Bitcoin Price Key Highlights
- Bitcoin price has sold off quite sharply recently, following a break of near-term support areas.
- Reversal patterns can be seen on the 4-hour time frame as bearish pressure picked up in the past few days.
- Bitcoin price is now down to the last line of defense on the 4-hour time frame, as a break below this level could mean more losses.
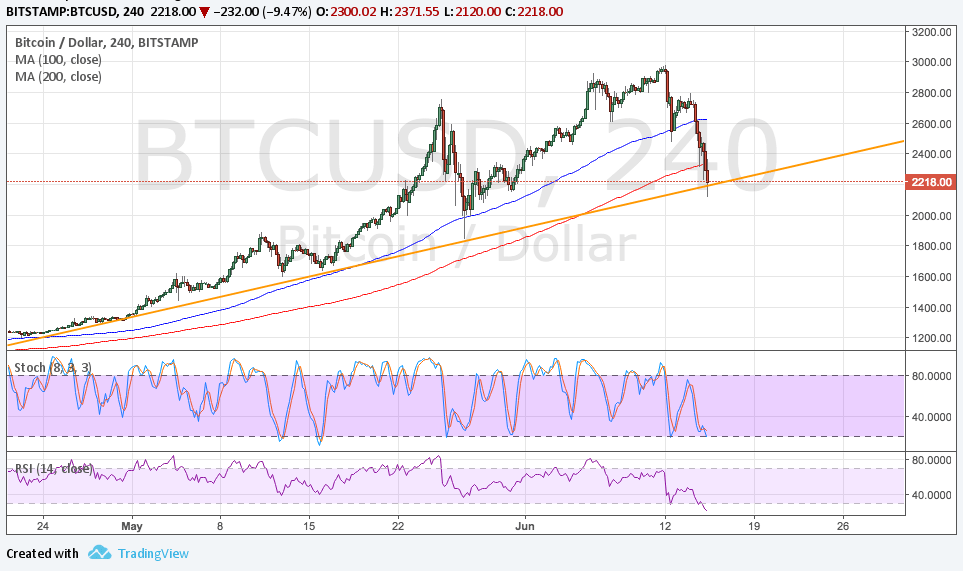
Bitcoin price is testing the long-term rising trend line on the 4-hour time frame and bears still seem to have enough energy for another breakdown.
Technical Indicators Signals
The 100 SMA is above the longer-term 200 SMA so the path of least resistance is to the upside. However, bitcoin price has broken below the 100 SMA dynamic support and also the 200 SMA inflection point to signal that bears are gaining the upper hand.
However, bitcoin price has just bounced off the rising trend line connecting the lows since the last week of May. A long spike has formed, indicating that buyers are trying to pare losses from this area.
But if the 100 SMA crosses below the longer-term 200 SMA soon, more sellers could get back in the game. Stochastic is still heading south to show that there’s bearish momentum left while RSI is also pointing down.
Both oscillators are dipping into overbought levels, though, so bears might need to book profits and take a break soon. If buyers are able to take over, a bounce back to the area of interest at $2600 could happen.

Market Factors
The latest FOMC statement turned out to be a hawkish surprise, as policymakers were undeterred in their plans to hike again before the end of the year. They even upgraded their growth and jobs forecasts while downgrading inflation estimates, confirming that they’re seeing the recent dips in data as transitory.
With that, dollar demand picked up across the board and weighed heavily on bitcoin price in the process. As for bitcoin, a number of cyberattacks on two major exchanges led investors to doubt the stability of the cryptocurrency once more.