Reason to trust

How Our News is Made
Strict editorial policy that focuses on accuracy, relevance, and impartiality
Ad discliamer
Morbi pretium leo et nisl aliquam mollis. Quisque arcu lorem, ultricies quis pellentesque nec, ullamcorper eu odio.
Key Highlights
- Creditbit price is slowly moving back lower and broke the 0.00028BTC support against the Bitcoin.
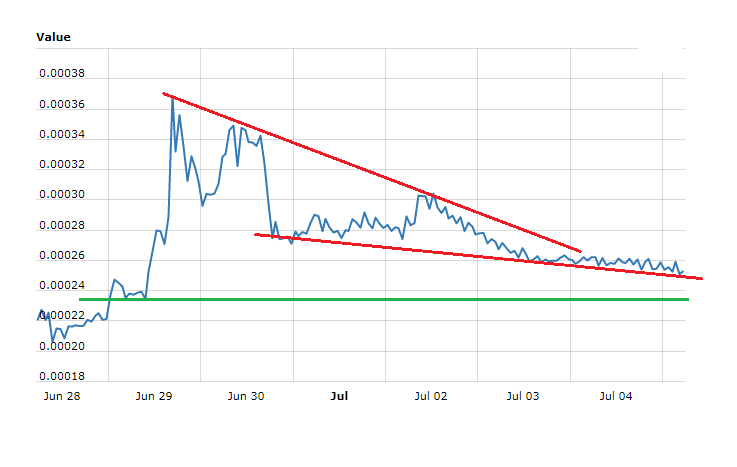
- There is a support trend line forming at 0.00025BTC on the 7-day chart of CRB/BTC (data feed from Coinmarketcap), which might be breached soon.
- The price might decline further and retest the 0.00022BTC support area in the near term.
Creditbit price is again moving lower against the US Dollar and Bitcoin, and CRB/BTC could face further pressure for a test of 0.00022BTC.
Creditbit Price Support
Recently we saw a rise in Creditbit price towards the 0.00036BTC level against the Bitcoin. Later, the price faced resistance and started a downside move below 0.00035BTC. The move was such that the price broke the 0.00030BTC support and the 38.2% Fib retracement level of the last wave from the 0.00022BTC low to 0.00036BTC high. It ignited further losses below 0.00028BTC and the price is now remains at a risk of more declines.
On the downside, there is a support trend line forming at 0.00025BTC on the 7-day chart of CRB/BTC (data feed from Coinmarketcap). It is currently holding losses and preventing sharp losses below 0.00025BTC. However, the price remains at a risk of a break below 0.00025BTC. Once it breaks 0.00025BTC, there can be a push towards the all-important 0.00022BTC support area.
The 76.4% Fib retracement level of the last wave from the 0.00022BTC low to 0.00036BTC high might be tested in the near term. If sellers gain pace, there is even a chance of a test of 0.00020BTC. On the upside, the broken support at 0.00028BTC might act as a resistance. Recoveries above 0.00028BTC might put the price back in the bullish zone above 0.00030BTC.
Looking at the indicators:
Hourly MACD – The MACD for the CRBIT/BTC pair has moved in the bearish zone.
Hourly RSI – The RSI for the CRBIT/BTC pair is below the 50 level and heading lower.
Intraday Support Level – 0.00022BTC
Intraday Resistance Level – 0.00028BTC
Charts from Coinmarketcap


