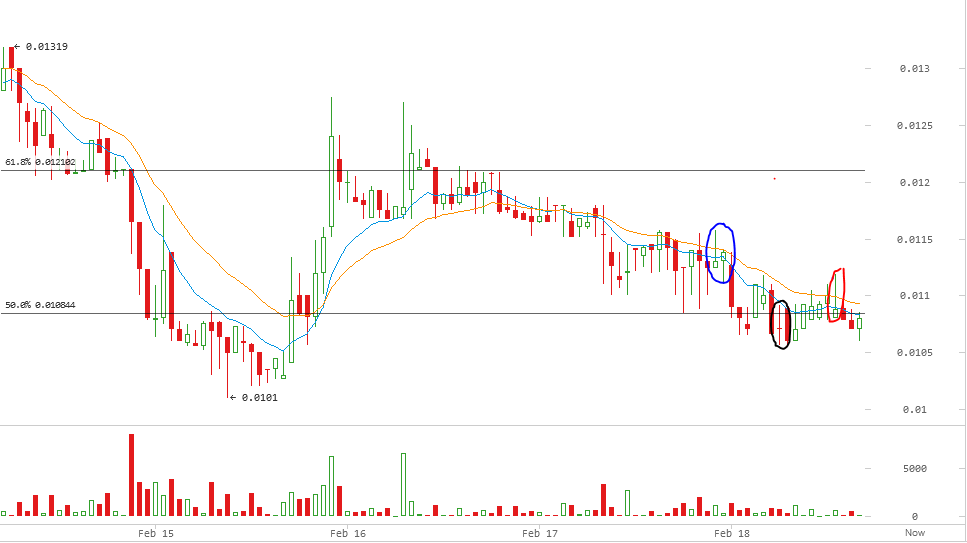
Despite the fact that darkcoin price increased yesterday from a low of around 0.01100 BTC to a high of around 0.01155 BTC, the market’s buying power failed to continue pushing the price towards the north as it fell down to a low of around 0.01055 BTC.
By studying the 1 hour Cryptsy (DRK/BTC) charts from tradingview.com, plotting the Fibonacci retracement as per our earlier analysis and plotting the 10 hour EMA (green curve) & 20 hour EMA (orange curve), we can notice the following:
- After reaching a high of 0.01155 BTC yesterday, DRK price started falling until it recorded a low of 0.01057 earlier today. The characteristic “hammer” and “gravestone” candlesticks (look at the pair of candles circled by the blue cloud on the below chart) proceeded reversal of the uptrend and should have been a signal to close long positions. Darkcoin price dropped below the 10 hour EMA and the 20 hour EMA, before the downtrend pulled the price down.
- DRK price fell below the 50% Fibonacci retracement level at 0.010844 BTC earlier today, yet shortly after breaking this level, the price attempted to go north to rise above this support level. The “doji” candlestick circled by the black cloud on the below chart proceeded reversal of the downtrend, which was a signal for weakening of the bearish market force.
- At the time of writing of this article, Darkcoin price is trading below the 10 hour EMA and the 20 hour EMA. Also, the price has breached the 0.010844 support level. Accordingly, it is likely that DRK price will continue dropping today, which can also be shown by the “gravestone” candlestick (look at the candlestick circled by the reddish cloud on the below chart).
Whether this bearish wave can take the price down to the 0.0101 BTC level or not, is yet to be determined during the upcoming few hours. However, it seems that the price will move sideways to the 0.010844 level for a few hours.
Chart from Cryptsy


