
Reason to trust
How Our News is Made
Strict editorial policy that focuses on accuracy, relevance, and impartiality
Ad discliamer
Morbi pretium leo et nisl aliquam mollis. Quisque arcu lorem, ultricies quis pellentesque nec, ullamcorper eu odio.
- ETH price managed to stay above the $130 support level and recovered above $132 against the US Dollar.
- There were swing moves near $130 before the price settled above the $132 pivot level.
- This week’s important bearish trend line was breached with resistance at $131 on the hourly chart of ETH/USD (data feed via Kraken).
- The pair is now facing a solid resistance near the $134 level and it could extend gains in the near term.
Ethereum price spiked a few times higher against the US Dollar and bitcoin. ETH formed a solid support near $130 and it may climb higher above the $134 and $135 resistance levels.
Ethereum Price Analysis
Yesterday, we saw a few swing moves near the $130 level in ETH price against the US Dollar. The ETH/USD pair spiked sharply below the $130 and $129 levels and later recovered above the $130 level. Later, there were consolidation moves before the price climbed above the $131 and $132 resistance levels. More importantly, there was a close above the $132 resistance and the 100 hourly simple moving average.
During the upside, this week’s important bearish trend line was breached with resistance at $131 on the hourly chart of ETH/USD. The pair broke the 50% Fib retracement level of the last slide $135 swing high to $129 swing low. It opened the doors for more gains above the $132 level. There was also a spike above the $133 level, but upsides were capped by the key $134 resistance. The price also faced sellers near the 76.4% Fib retracement level of the last slide $135 swing high to $129 swing low. It is currently consolidating above the $132 support and the 100 hourly SMA.
On the upside, the price needs to clear the $134 resistance to continue higher. The next main resistance is near the last swing high at $135. Once the price clears both hurdles, it is likely to test the $140 resistance. On the other hand, if there is a downside correction, the $132 level might provide support. Any further losses might push it back towards the $130 support.
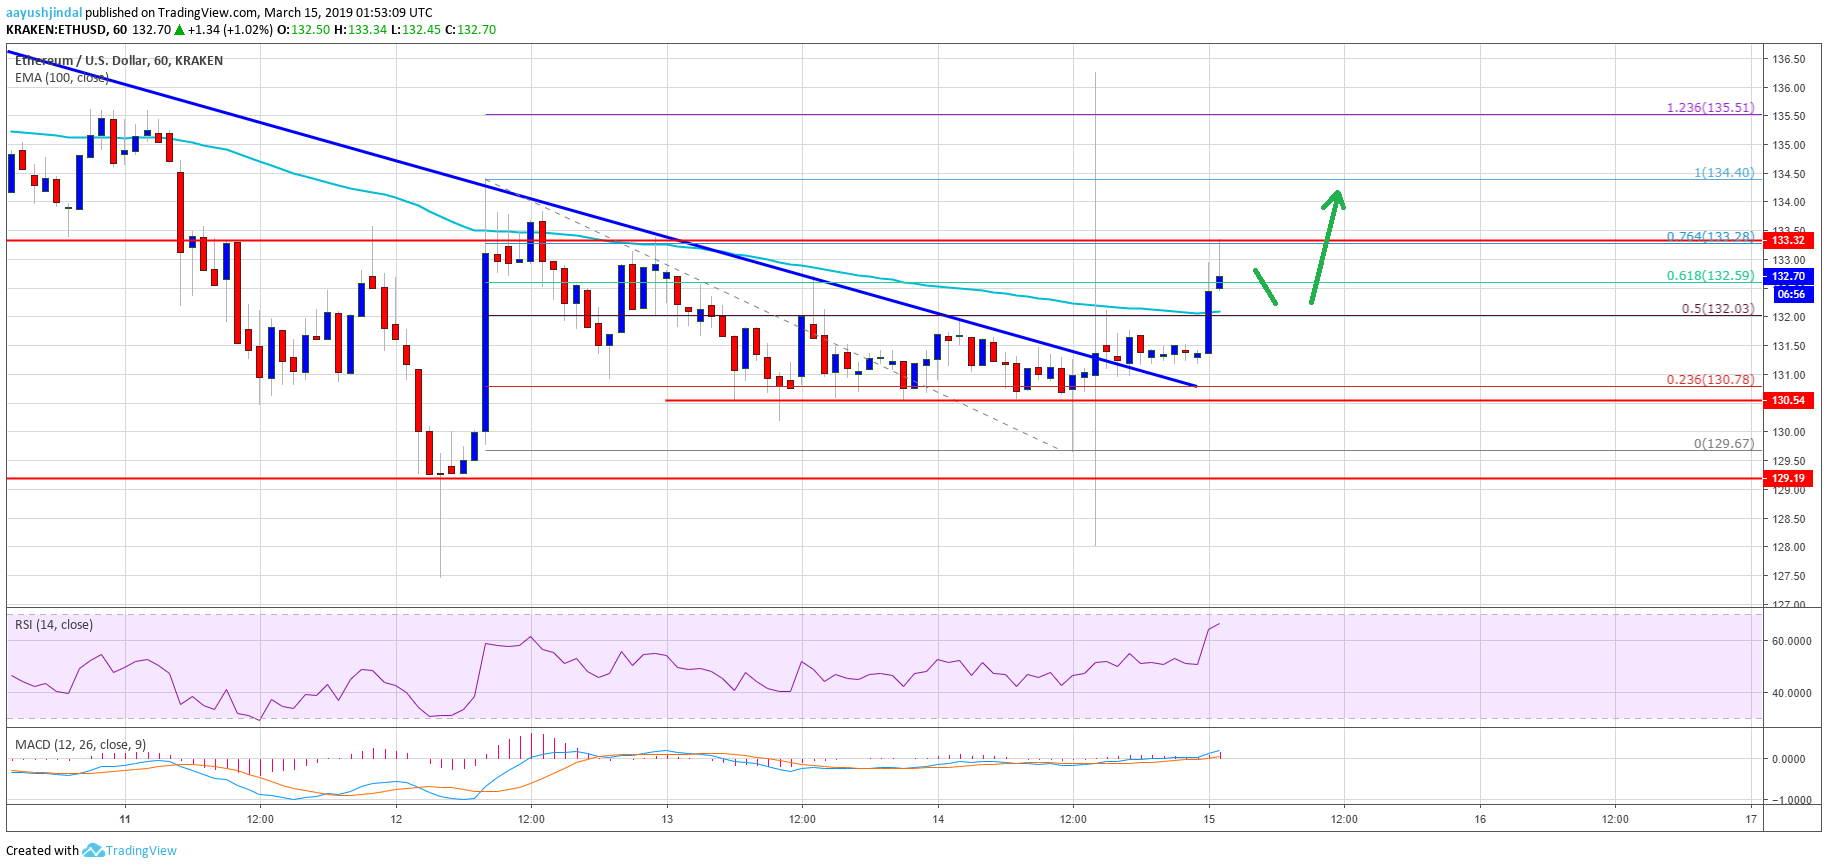
Looking at the chart, ETH price clearly made a few nasty moves, but it managed to settle above $132, which is a positive sign. As long as it stays above the $132 support and the 100 hourly SMA, it remains supported for more upsides towards the $135, $137 and $140 levels.
ETH Technical Indicators
Hourly MACD – The MACD for ETH/USD is gaining pace in the bullish zone.
Hourly RSI – The RSI for ETH/USD climbed well above the 60 level and it is currently correcting lower towards 55.
Major Support Level – $132
Major Resistance Level – $135


