
Reason to trust
How Our News is Made
Strict editorial policy that focuses on accuracy, relevance, and impartiality
Ad discliamer
Morbi pretium leo et nisl aliquam mollis. Quisque arcu lorem, ultricies quis pellentesque nec, ullamcorper eu odio.
Key Highlights
- ETH price declined heavily after it broke the $200 and $190 supports against the US Dollar.
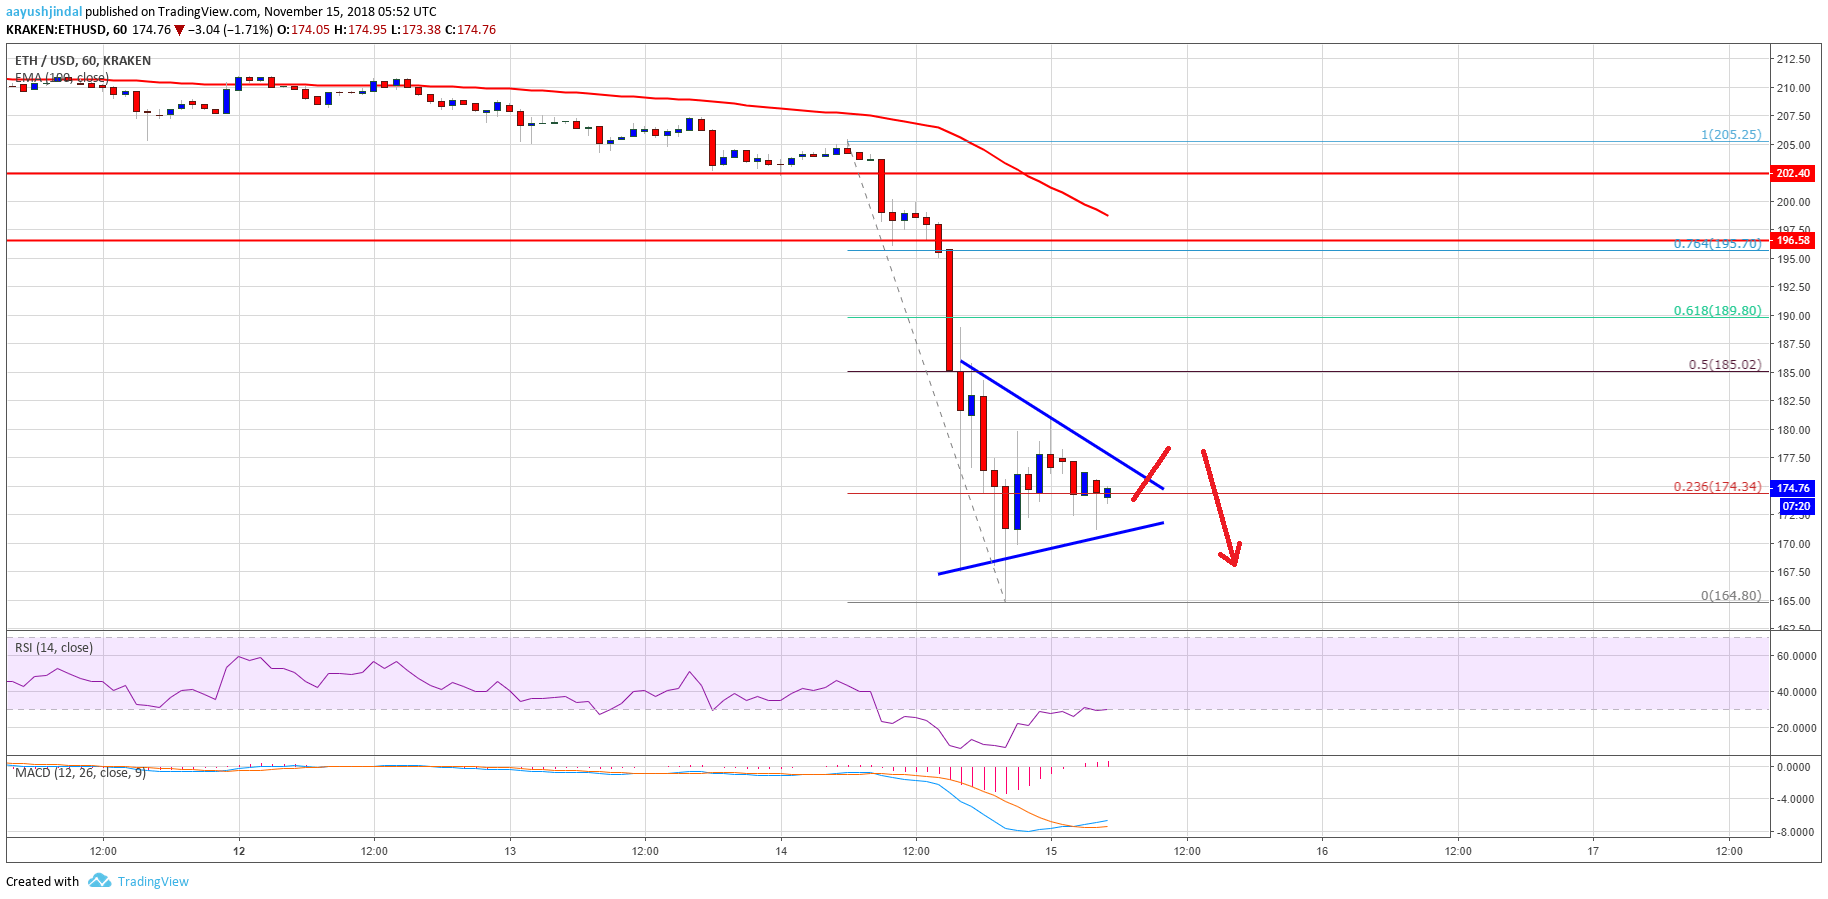
- There is a short term contracting triangle formed with resistance at $178 on the hourly chart of ETH/USD (data feed via Kraken).
- The pair could correct higher, but upsides are likely to be capped near $180 or $185.
Ethereum price declined heavily against the US Dollar and bitcoin. ETH/USD tested the $165 level and it remains at a risk of more losses.
Ethereum Price Analysis
There was a nasty decline in ETH price below the $200 support area against the US Dollar. Bitcoin price tumbled heavily, which increased selling pressure and pushed the ETH/USD pair below the $180 and $170 levels. The price traded to a new monthly low at $165 and it is currently well below the 100 hourly simple moving average. At the moment, the price is consolidating losses above the $165 level with a bearish angle.
It recovered above the 23.6% Fib retracement level of the recent drop from the $205 high to $165 low. However, the upside move faced a strong resistance near the $180 level. More importantly, there is a short term contracting triangle formed with resistance at $178 on the hourly chart of ETH/USD. The pair may continue to move in a range below $180 before it makes the next move. If there is a downside break below $170, the price could trade below the $165 low. The next major support is close to the $150 level. On the other hand, a break above $180 is likely to face sellers near $185. It represents the 50% Fib retracement level of the recent drop from the $205 high to $165 low.
Looking at the chart, ETH price remains at a risk of more losses below $170 and $165. Selling rallies close to $180 or $185 can be considered as long as there is no close above $200.
Hourly MACD – The MACD is slightly in the bullish zone.
Hourly RSI – The RSI is currently near the 30 level.
Major Support Level – $165
Major Resistance Level – $180


