Key Highlights
- ETH price is attempting an upside move above $290 against the US Dollar, but lacking momentum.
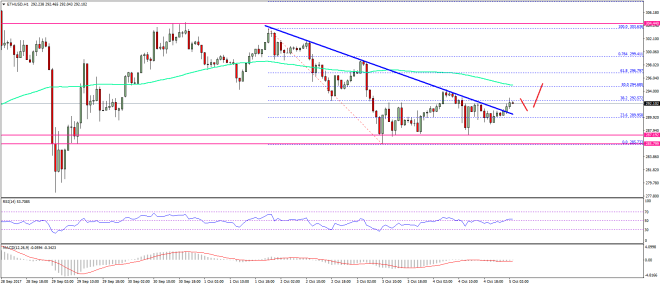
- There was a break above a key bearish trend line with resistance at $290 on the hourly chart of ETH/USD (data feed via SimpleFX).
- The price needs to gain pace above $292 to surpass the 100 hourly simple moving average.
Ethereum price is attempting an upside move against the US Dollar and Bitcoin. ETH/USD needs to gather pace above $292 in order to capitalize further.
Ethereum Price Resistance
There were multiple attempts to break the $287-286 support zone in ETH price against the US Dollar. The price formed a decent support at $286 and started an upside move. It broke the 23.6% Fib retracement level of the last decline from the $303.63 high to $285.75 low. Moreover, there was a break above a key bearish trend line with resistance at $290 on the hourly chart of ETH/USD. These are positive signs above $290, but the pair is lacking momentum.
Therefore, any further gains above $292 won’t be easy. The most important resistance is near the 50% Fib retracement level of the last decline from the $303.63 high to $285.75 low. The 100 hourly simple moving average is also near $294 to act as a hurdle. There is a chance of another dip in prices towards $290-288 before buyers step in again.
As long as the price is above $287-286, it remains supported. Any dips can be bought above $286, but with caution. A close below the stated support might take the price towards $277. On the upside, buyers need to gain momentum above $292 and $294 to register good gains in the near term.
Hourly MACD – The MACD is almost flat and attempting to settle in the bullish zone.
Hourly RSI – The RSI is just near the 50 level and struggling to gain momentum.
Major Support Level – $286
Major Resistance Level – $294
Charts courtesy – SimpleFX


