Key Highlights
- Ethereum price moved higher after a correction against the US Dollar and traded just as highlighted in yesterday’s post.
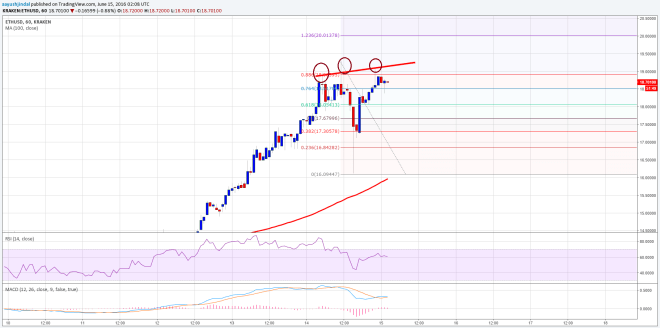
- There is a bearish trend line formed on the hourly chart (data feed via Kraken) of ETH/USD, which may act as a swing area in the short term.
- There is a chance of ETH moving towards the $20.00 level if the bulls remain in control.
Ethereum price traded higher just as I highlighted yesterday. Moving ahead, if all goes well, ETH might trade towards the $20.00 level.
Ethereum Price Overbought?
Ethereum price ETH yesterday corrected a few points down to trade near $16.0 where it found buyers against the US Dollar and started to move higher once again. The price has almost retraced all gains, and currently trading near the last swing high of $19.30. Currently, there is a bearish trend line formed on the hourly chart (data feed via Kraken) of ETH/USD, which may play a major role in the short term.
If the ETH bulls remain in control, and manages to break the highlighted trend line and resistance area, then a move towards the all-important $20.0 level is possible. It also represents the 1.236 extension of the last drop from the $19.30 high to $16.09 low. So, there is a chance that sellers appearing just around the $20.0-$20.20 levels.

On the downside, the $18.00 level can be seen as an initial support. However, as I mentioned many times, the most important buy zone for ETH/USD is now around $15.0. The stated level was a resistance earlier and now might act as a support area.
Hourly MACD – The MACD just moved into the bullish zone, calling for more gains in ETH.
Hourly RSI – The RSI is above the 50 level, which is a positive sign for the ETH bulls.
Major Support Level – $18.00
Major Resistance Level – $19.30
Charts courtesy of Kraken via Trading View


