Reason to trust

How Our News is Made
Strict editorial policy that focuses on accuracy, relevance, and impartiality
Ad discliamer
Morbi pretium leo et nisl aliquam mollis. Quisque arcu lorem, ultricies quis pellentesque nec, ullamcorper eu odio.
Key Highlights
- ETH price moved higher and was successful in breaking a major resistance near $390-395 against the US Dollar.
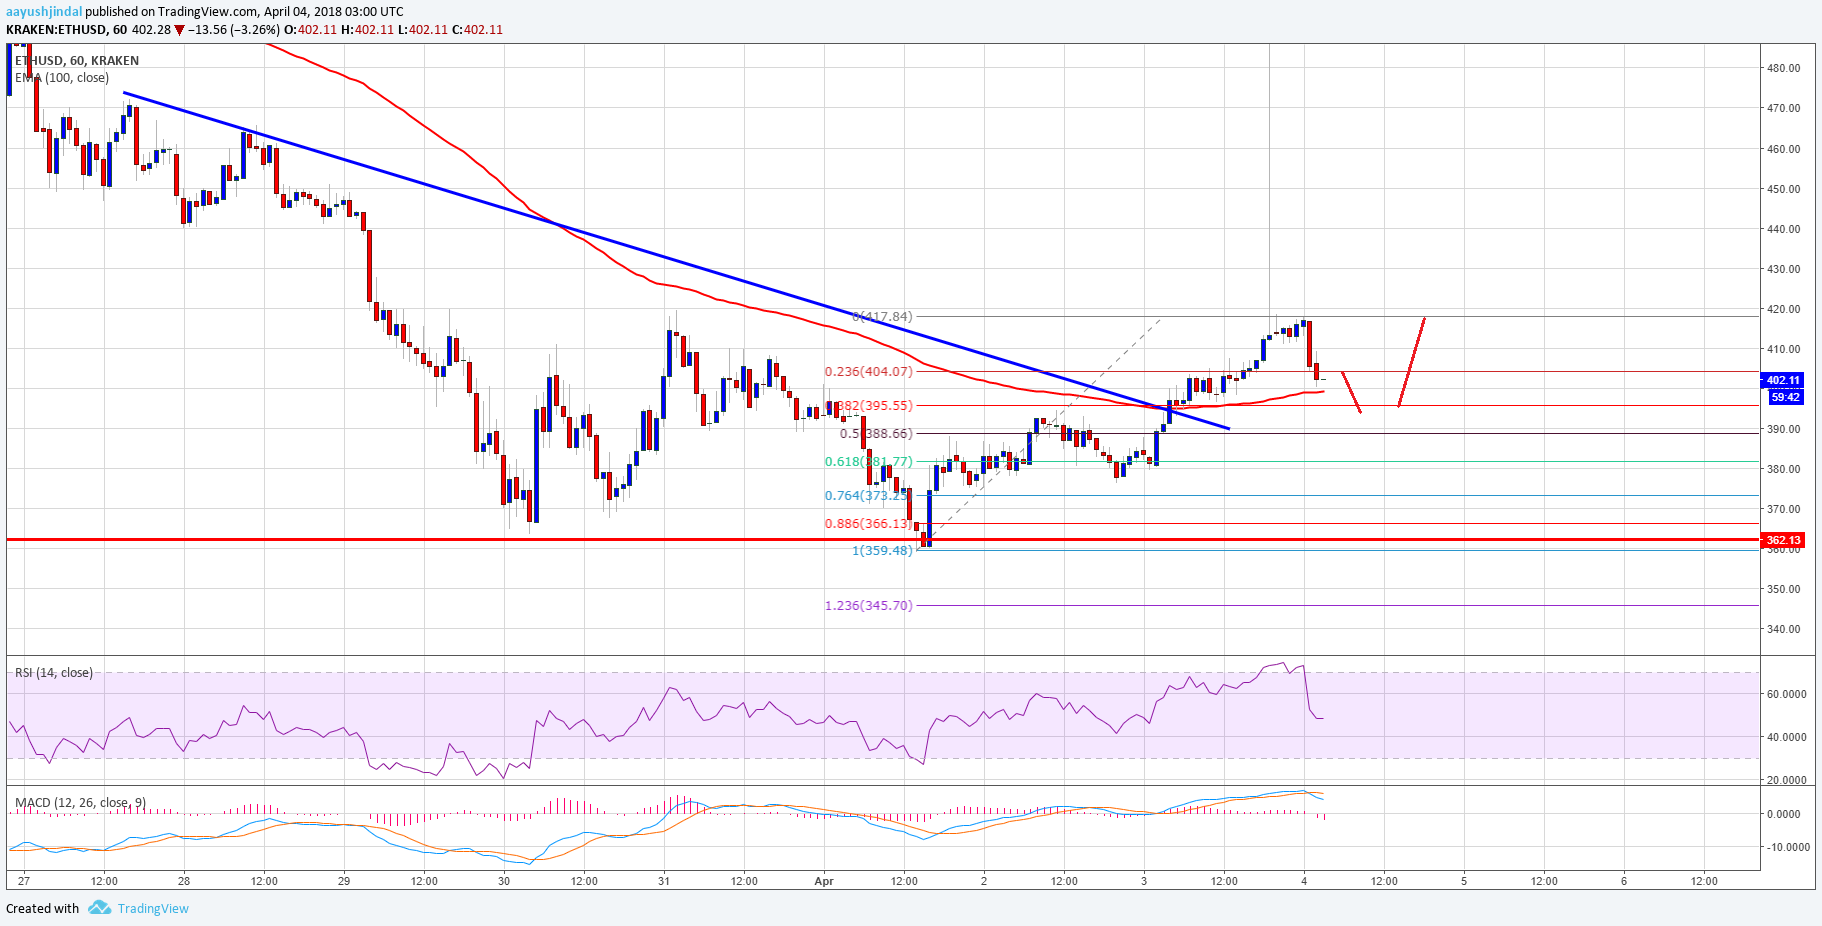
- Yesterday’s highlighted major bearish trend line with resistance at $395 was breached on the hourly chart of ETH/USD (data feed via Kraken).
- The pair traded above the $415 level before starting a downside correction recently.
Ethereum price is showing a few positive signs against the US Dollar and Bitcoin. ETH/USD remains supported on the downside around the $400 and $395 levels.
Ethereum Price Support
There was a decent start to an upside wave from the $370 level in ETH price against the US Dollar. The price gained momentum and it was able to break a major resistance near the $390-395 zone. It also cleared the 50% Fib retracement level of the last decline from the $430 high to $360 low. It opened the doors for more gains and the price moved above the $400 level.
More importantly, yesterday’s highlighted major bearish trend line with resistance at $395 was breached on the hourly chart of ETH/USD. The pair traded as high as $417.84 before it faced sellers. Later, a downside correction was initiated and the price moved below $410. It also traded below the 23.6% Fib retracement level of the last wave from the $359 low to $417 high. However, there is a major support near the $400 level and the 100 hourly simple moving average.

Furthermore, the 38.2% Fib retracement level of the last wave from the $359 low to $417 high may also act as a support around the $395 level. If the price fails to stay above the $395 and $390 supports, there could be a retest of $360. On the upside, the price has to move past $317-320 zone for more gains in the near term.
Hourly MACD – The MACD is moving back in the bearish zone.
Hourly RSI – The RSI is moved back below the 50 level.
Major Support Level – $390
Major Resistance Level – $417
Charts courtesy – Trading View


did you mean $417-420 in the last paragraph