Reason to trust

How Our News is Made
Strict editorial policy that focuses on accuracy, relevance, and impartiality
Ad discliamer
Morbi pretium leo et nisl aliquam mollis. Quisque arcu lorem, ultricies quis pellentesque nec, ullamcorper eu odio.
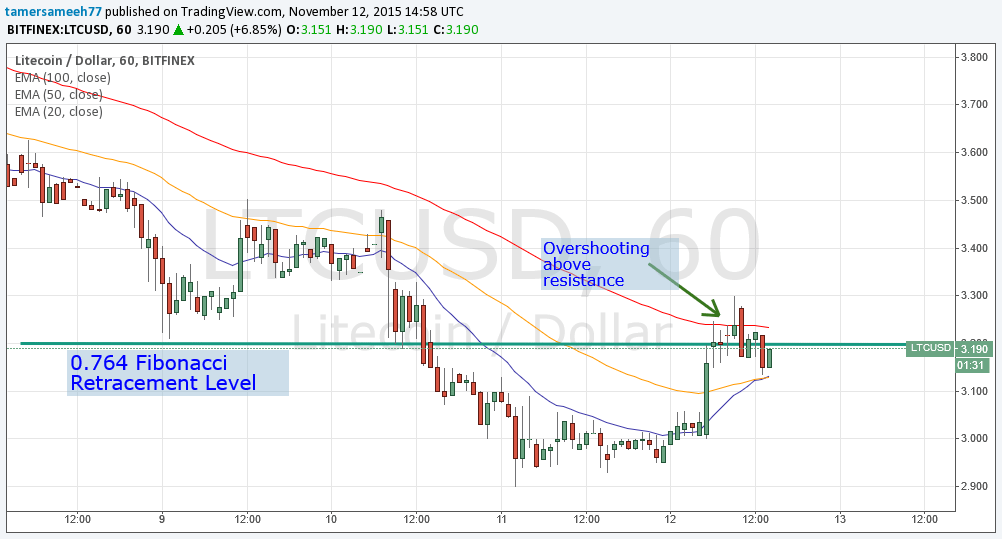
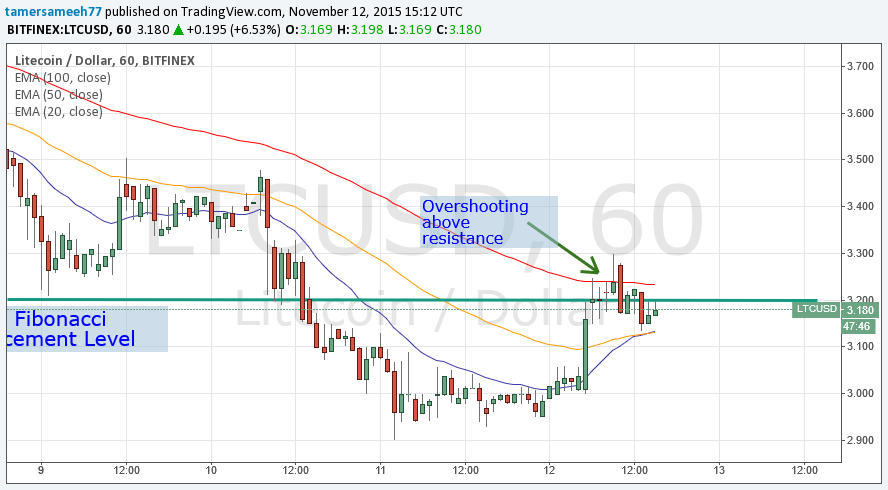
Litecoin price surged to print a high of $3.30 earlier today. The price is technically testing now the resistance at $3.20 again now as I write this analysis. The $3.20 corresponds to the 0.764 retracement level according to the Fibonacci retracement we plotted on our analysis on the 2nd of November.
Overshooting Above Resistance:
Let’s take a look at the 1 hour (LTC/USD) chart from Bitfinex (Look at the below chart), plot the 20, 50 and 100 EMAs and keep the 0.764 Fibonacci retracement level according to the Fib retracement we plotted earlier this month. We can notice the following:
- Litecoin price started rising earlier today and 4 successive bullish candlesticks were printed, before the price jumped to score a high of $3.30. As we can see on the below chart, the price now fell below $3.2 which corresponds to the 0.764 Fib retracement level, so it seems that this level is resisting further advancement as the price fell below it, shortly after breaching it.
- Litecoin is now trading below the 100 EMA but above both the 20 and 50 EMAs. The 20 and 50 EMAs are now at the same level, which reflects indecisiveness of the market during the past few days.

Still Bearish On 1 Day Charts:
Be examining the 1 day (LTC/USD) charts from Bitfinex (look at the below chart), plotting the William’s Alligator indicator and executing the MACD indicator, we can conclude the following:
- Even though we experienced a price surge today, the overall pattern of the market is pointing towards an eminent drop that heads towards the $2.8 level, especially the MACD is downwards sloping and the red negative trend line is traveling above the blue positive trend line.
- William’s Alligator indicator moving averages aren’t reflecting the current uptrend, so we can say that the “Alligator is sleeping”

Conclusion:
Litecoin price surged to score a high of $3.30 earlier today; however, our technical analysis is in favor of fall in litecoin price that heads towards $2.8 within the next few days.
Charts from Bitfinex; hosted by Tradingview.com


