Reason to trust

How Our News is Made
Strict editorial policy that focuses on accuracy, relevance, and impartiality
Ad discliamer
Morbi pretium leo et nisl aliquam mollis. Quisque arcu lorem, ultricies quis pellentesque nec, ullamcorper eu odio.
The rocket has run out of fuel, and it’s crashing! Yes, I am talking about Litecoin.
The dream investment of many until Friday has turned into a nightmare today. And those who are still holding on to their Litecoin investments may witness more pain. The speculators with deep pockets look set to unravel more of their long positions and cause a steep decline in the price of the cryptocurrency.
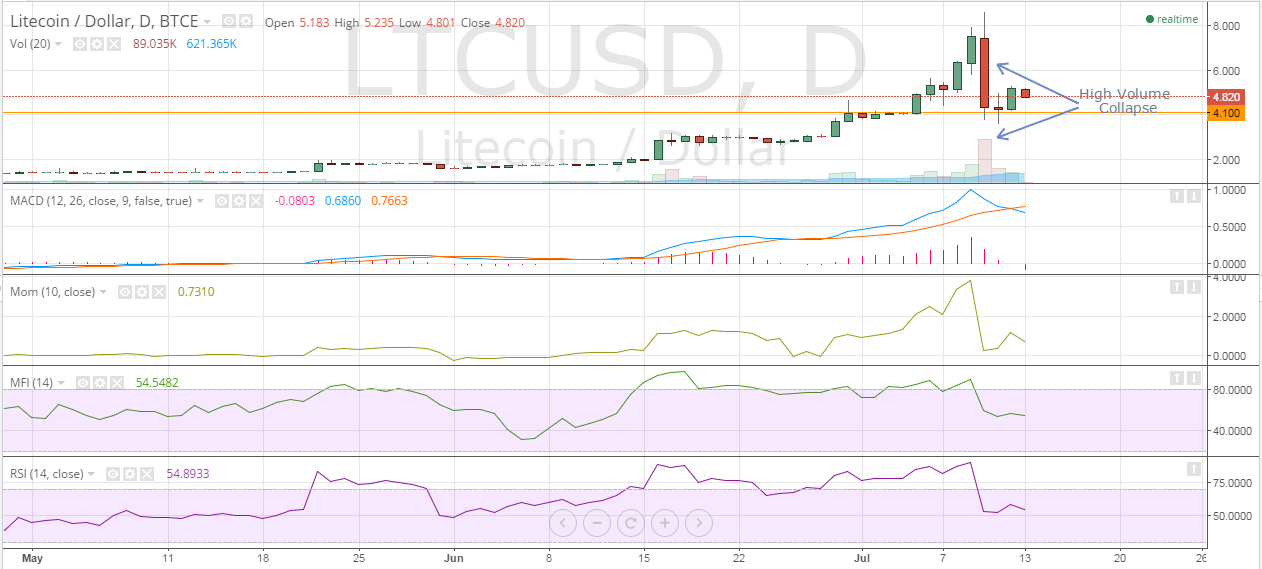
For those who were unable to track the market during the weekend, Litecoin crashed a biblical 58.26% from a high of $8.650 to a low of $3.610 in a matter of less than 48 hours.
Litecoin pared the losses but is still substantially lower at $4.820.
Image: https://www.tradingview.com/x/l8mDEngj/
Let’s take a look at the technical analysis of the Daily LTC-USD price chart below.
Litecoin Chart Structure – During the collapse, Litecoin dived below the previous consolidation level of $4.100 (marked as the orange line) as panic gripped the market. However, short covering saw Litecoin close the day above it. The support of $4.100 may eventually cave under pressure.
Moving Average Convergence Divergence – The MACD has crossed the Signal Line on the downside. The latest MACD value is 0.6860 while the latest Signal Line value is 0.7663.
Momentum – The Momentum indicator has witnessed a sharp decline but is managing in the positive region at 0.7310.
Money Flow Index – The MFI is near the neutral level with a value of 54.5482.
Relative Strength Index – The Daily RSI has also dropped from overheated readings to 54.8933.
Conclusion
Technical analysis of Litecoin confirms that reality has hit the market hard and it is returning to normalcy. But, in case the bears increase the pressure and the floor of $4.100 breaks, I see another round of colossal damage coming to the buyers!
Do not rush in to buy or short the cryptocurrency at the current levels. Wait to see what the market intends to do before initiating a trade. And get out of long positions now!


