Key Highlights
- Ripple price failed to hold an important support at $0.1960 against the US Dollar and moved down.
- This week’s highlighted major channel with support at $0.1960 was broken on the hourly chart of the XRP/USD pair (data source from Kraken).
- The price is currently trading near the $0.1880 support and attempting an upside recovery.
Ripple price declined substantially against the US Dollar and Bitcoin. XRP/USD broke $0.1950, which may now act as a resistance in the short term.
Ripple Price Resistance
This week, we followed a major support area at $0.1960-0.1950 in Ripple price against the US Dollar. There were many attempts by sellers to break $0.1950, but they failed. Similarly, buyers failed to push the price above $0.2050. At the end, sellers had the upper hand as they succeeded in breaking the $0.1950 support area. The worst part was the fact that this week’s highlighted major channel with support at $0.1960 was broken on the hourly chart of the XRP/USD pair.
It opened the doors for more slides and the pair traded below $0.1900. A low as formed at $0.1880 recently from where the pair is currently attempting a correction. An initial resistance is around the 23.6% Fib retracement level of the last drop from the $0.2050 high to $0.1880 low. However, the most important resistance is near $0.1960 and $0.1950. Moreover, the 50% Fib retracement level of the last drop from the $0.2050 high to $0.1880 low is at $0.1964.
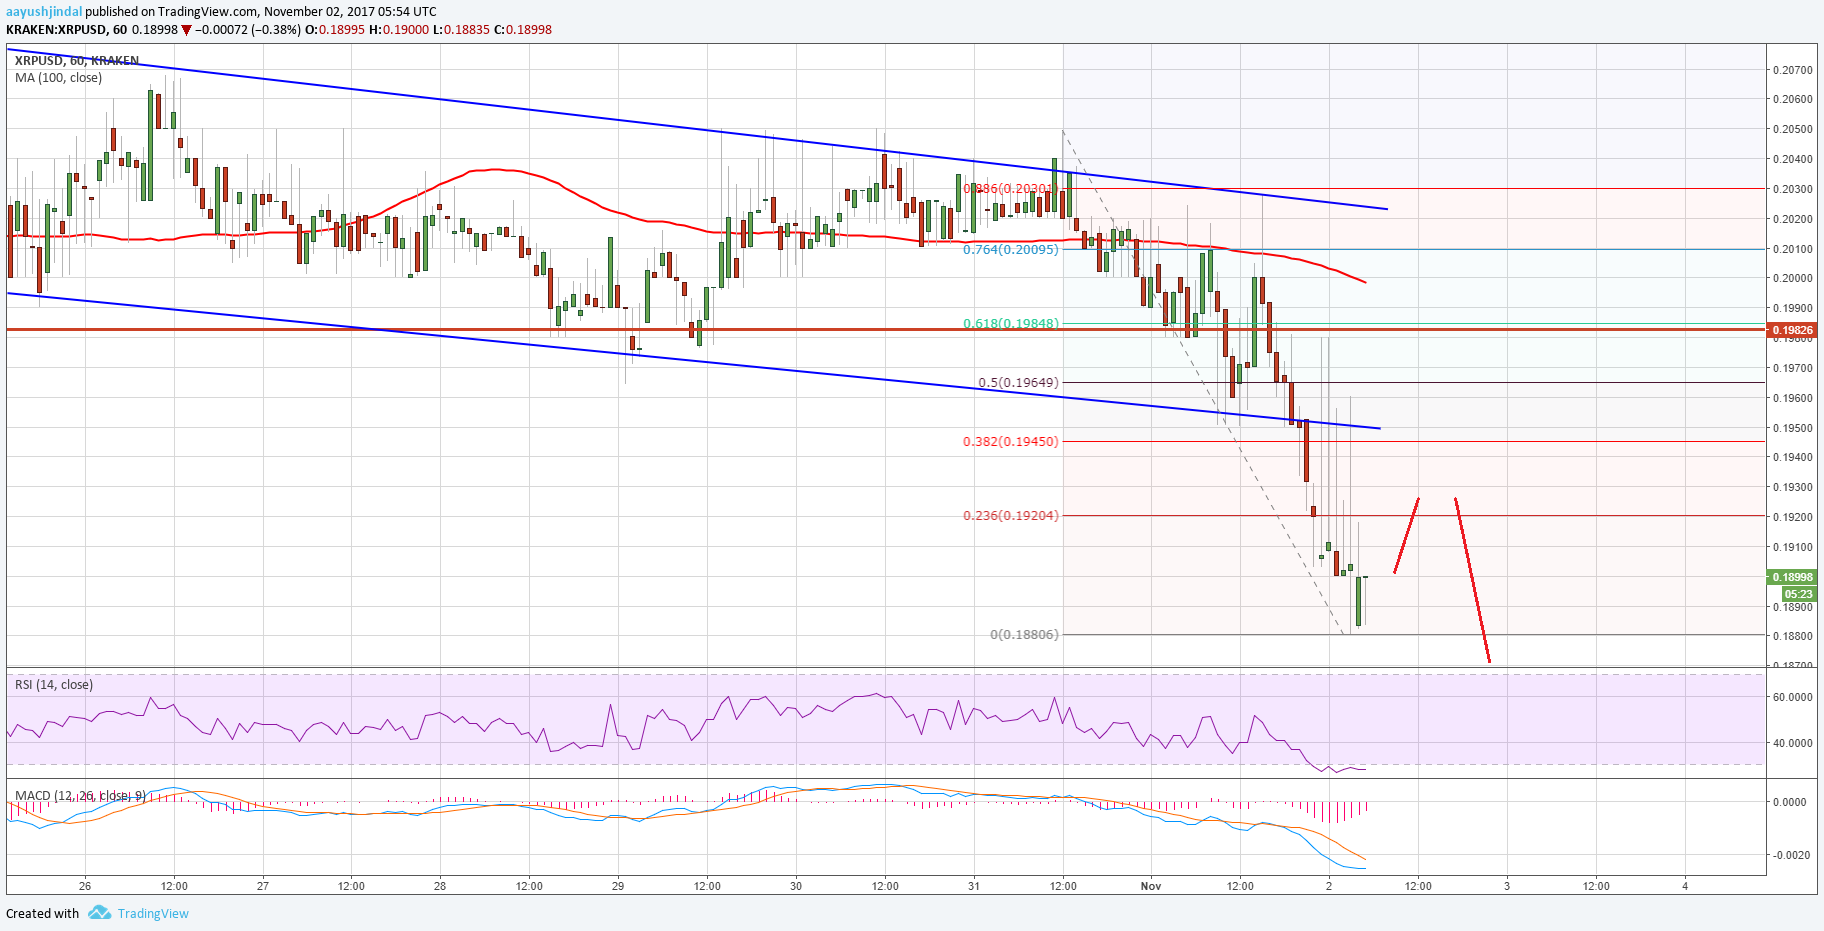
Therefore, any corrections from the current levels are likely to find barrier at $0.1960. On the downside, the recent low at $0.1880 is a decent support. A break of $0.1880 would call for a test of $0.1800.
Looking at the technical indicators:
Hourly MACD – The MACD for XRP/USD is currently reducing the bearish zone.
Hourly RSI (Relative Strength Index) – The RSI for XRP/USD is currently in the oversold region.
Major Support Level – $0.1880
Major Resistance Level – $0.1960
Charts courtesy – Trading View, Kraken