

Bitcoin has been trading at $50,000 and higher, reviving interest surrounding the cryptocurrency market and especially the altcoin sector. Ethereum and other top coins have all set new price records just as Bitcoin did, but have since started to correct.
There are at least five technical signs, however, that suggest that this isn’t a top in altcoins, but instead is a bullish retest and a prelude of the most powerful altcoin season yet.
Crypto Market Crossroads: Bitcoin Dominance Ready To Dive, Alts To Soar
Before even looking at the altcoin market cap at all, Bitcoin dominance tells a lot of the story ahead.
BTC dominance is a metric that weighs the top cryptocurrency against the share of the rest of the market cap held by altcoins like Ethereum and Tether.
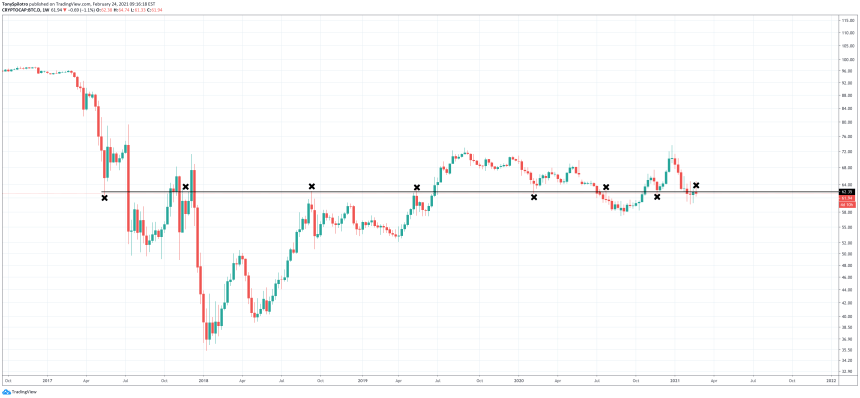

The struggle for roughly 63% dominance has been a hard fought battle | Source: CRYPTOCAP-BTC.D on TradingView.com
Bitcoin and altcoins have fought long and hard in a battle for two-thirds dominance overall.
Related Reading | Altcoin Season Is Here: “Buy Crypto” Surpases Bitcoin Searches On Google
Altcoins got the upper hand in 2018 as Bitcoin began to correct, but since then the leading cryptocurrency by market cap has enjoyed two-thirds or above, but is now at risk of losing the key level.

Dominance fell through the cloud and has been rejected since | Source: CRYPTOCAP-BTC.D on TradingView.com
On the same weekly timeframe, the Ichimoku indicator shows a rejection from the cloud (pictured above) that coincides with losing the 63% level.
There was a similar rejection at the middle-BB on the Bollinger Bands (pictured below), after several attempts, suggesting at least a drop to the lower band is likely in the cards.

Bitcoin dominance was also rejected from the mid-Bollinger Band | Source: CRYPTOCAP-BTC.D on TradingView.com
Powerful Signs That Altcoin Season Is Only Just Getting Started
The most telling sign that altcoin season hasn’t even started yet, can be seen on the Average Directional Index. The ADX is a trend strength measuring tool that also includes two Directional Movement Index lines.
The ADX itself has dropped below a reading of 20, suggesting the prevailing trend has completed, and a new trend is brewing.
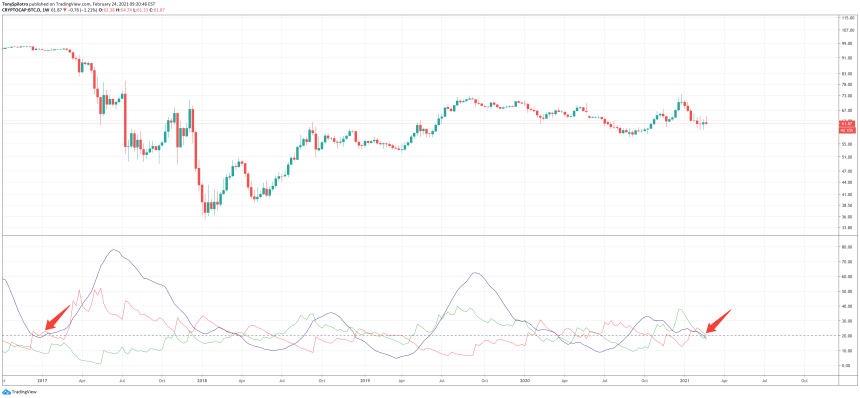
The ADX is back below 20 while bears have back taken control | Source: CRYPTOCAP-BTC.D on TradingView.com
At the same time, the red DMI has completed a bearish crossover, signaling that sellers are now in control – or in this case, altcoins will get the upper hand against Bitcoin.
Related Reading | Altcoin Market Cap On The Verge Of Life-Changing Breakout
Moving onto the total altcoin market cap itself sans BTC, the technicals depict a bullish retest that could lead to one of the most shocking phases of wealth generation ever witnessed.
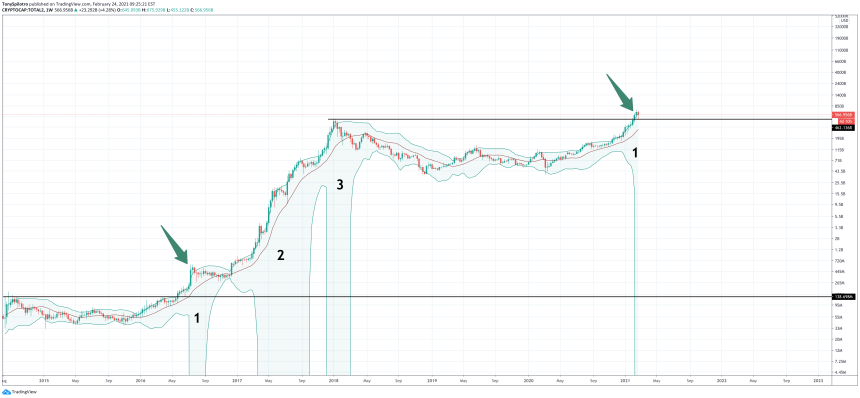
The altcoin market cap has only just broken out, and has a lot more to go | Source: CRYPTOCAP-TOTAL2 on TradingView.com
Coinciding with the bullish retest and breakout from resistance, the Bollinger Bands have widened to an extreme not seen since the last bull market.
During the past bull cycle for altcoins, there were not one, but three total bullish impulses that sent the Bollinger Bands in a spiral. The volatility measuring indicator this time around only shows just one bullish phase, potentially suggesting that there’s so much more to go before the current rally in crypto is over.
Featured image from Deposit Photos, Charts from TradingView.com